

Question
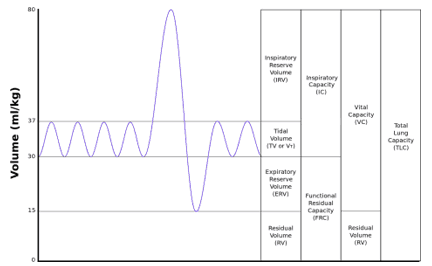
A spirometry curve of a patient has been provided below. Calculate the FEV1/FVC ratio from the curve:

| A. |
60-69% |
| B. |
70-79% |
| C. |
80-89% |
| D. |
90-99% |
Show Answer


|
Correct Answer » A Explanation |
 |

- The graph represents a volume–time spirometry curve.
- After a maximal inspiration, a forced expiration is performed.
- The curve shows a relatively slow and prolonged expiration instead of a steep drop.
- This indicates reduced expiratory flow.
Explanation of the Clinical Question
- FEV1 = volume exhaled in first 1 second of forced expiration
- FVC = total volume exhaled after full forced expiration
Formula
FEV1/FVC ratio = (Volume exhaled in first 1 second / Total forced vital capacity) × 100
Explanation of the Correct Answer
- In the curve, early expiration is not rapid, indicating reduced FEV1.
- Total FVC is relatively preserved compared to FEV1.
- Therefore, the ratio is reduced.
- Estimated value falls below normal (~80%) and lies in the range 60–69%.
Spirometry Definitions
- FEV1: Forced expiratory volume in first second
- FVC: Total forced vital capacity
Normal Values
- Normal FEV1/FVC ≈ 75–80%
Obstructive Lung Disease
- FEV1 markedly decreased
- FVC normal or mildly decreased
- FEV1/FVC decreased (<70%)
- Examples: Asthma, COPD, bronchiectasis
Restrictive Lung Disease
- FEV1 decreased
- FVC decreased proportionately
- FEV1/FVC normal or increased
- Examples: Pulmonary fibrosis, sarcoidosis
Key Exam Points
- FEV1/FVC < 70% indicates obstructive pattern
- Normal or increased ratio with low volumes indicates restrictive pattern
- Volume–time curve: used to calculate FEV1 and FVC
- Flow–volume loop: used to identify pattern visually
Quick Interpretation Rule
- Slow, prolonged expiration → Obstructive → Decreased ratio
- Rapid expiration with low volume → Restrictive → Normal or increased ratio