

Question
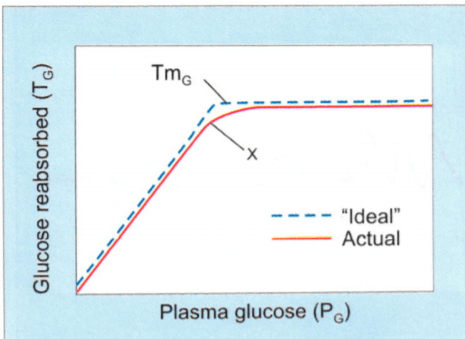
The relation between the plasma glucose level (PG) and amount of glucose reabsorbed (TG) has been shown in the following diagram. The difference between the ideal and actual graph (point X) indicate:

| A. |
Effective renal glucose absorption |
| B. |
Transport maximum of glucose |
| C. |
Glomerulotubular balance |
| D. |
Splay effect |
Show Answer


|
Correct Answer � D Explanation |
 |

Ans. D. Splay effect
- The difference between actual and ideal curve is splay effect.
SPLAY EFFECT:
- Deviation in renal threshold (from calculated predicted value)
– Due to nephron heterogeneity.
– Not all nephrons have TmG of 375 mg/min
- Once Tm for kidneys (375 mg/min) is reached, all nephrons reached maximal capacity to reabsorb glucose.
– Further, not all nephrons are maximally active simultaneously.