

Question
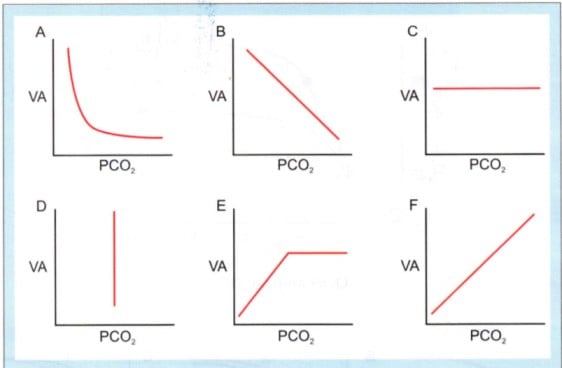
Which diagram best describes the relationship between alveolar ventilation (VA) & arterial carbon-di-oxide tension (PCO2) when PCO2 is changed acutely over a range of 35 to 75 mm Hg?

| A. |
Curve A |
| B. |
Curve D |
| C. |
Curve E |
| D. |
Curve F |
Show Answer


|
Correct Answer � D Explanation |
 |

Ans. D. Curve F.
- Alveolar ventilation can increase by more than eightfold when the arterial carbon dioxide tension is increased over a physiological range from about 35-75 mm Hg.
- This increase is linear.