


Question
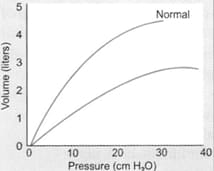
The given graph likely depicts which of the following disease?

A. Bronchial asthma
B. Emphysema
C. Interstitial lung disease
D. Normal study
Show Answer


|
Correct Answer » C Explanation |
 |

Ans: C. Interstitial lung disease
(Ref Ganong 24/e p631)
- Pressure-volume loop – Compliance curve.
- Shows decreased slope – Implying decreased compliance (AV/AP).
- Typically seen in restrictive lung diseases & interstitial lung disease.
- Emphysema – Obstructive lung conditions & increases compliance.
| Static Expiratory Pressure-Volume Curves of Lungs | ||
| Shift | Shift | Compliance |
| Downward & to right |
|
Compliance is decreased° |
| Upward & to left |
|
Compliance is
|