
BIOSTATISTICS-Normal Curve, Test of significance, Standard error
NORMAL DISTRIBUTION CURVE:
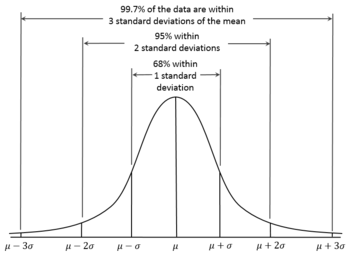
- Gaussian curve
- Half of the observations lie above and half below the mean
- Normal or Gaussian distribution
PROPERTIES:
- Bell shaped.
- Symmetrical about the midpoint.
- Total area of the curve is 1. Its mean zero & standard deviation 1.
- Height of curve is maximum at the mean and all three measures of central tendency coincide.
- Maximum number of observations is at the value of the variable corresponding to the mean, numbers of observations gradually decreases on either side with few observations at extreme points.
- Area under the curve between any two points can be found out in terms of a relationship between the mean and the standard deviation as follows:
- Mean ± 1 SD covers 68.3% of the observations
- Mean ± 2 SD covers 95.4% of the observations
- Mean ± 3 SD covers 99.7% of the observations
- These limits on either side of mean are called confidence limits.
- Forms the basis for various tests of significance .
Skewness
- It is the degree of distortion from the symmetrical bell curve or the normal distribution. It measures the lack of symmetry in data distribution.
- It differentiates extreme values in one versus the other tail. A symmetrical distribution will have a skewness of 0.
- Positive Skewness means when the tail on the right side of the distribution is longer or fatter. The mean and median will be greater than the mode.
- Negative Skewness is when the tail of the left side of the distribution is longer or fatter than the tail on the right side. The mean and median will be less than the mode.

TESTS OF SIGNIFICANCE:
- Different samples drawn from the same population, estimates differ – sampling variability.
- To know if the differences between the estimates of different samples is due to sampling variations or not – tests of significance.
- Null hypothesis
- Alternative hypothesis
NULL HYPOTHESIS:
- There is no real difference in the sample(s) and the population in the particular matter under consideration and the difference found is accidental and arises out of sampling variation.
ALTERNATIVE HYPOTHESIS:
- Alternative when null hypothesis is rejected.
- States that there is a difference between the two groups being compared
LEVEL OF SIGNIFICANCE:
- After setting up a hypothesis, null hypothesis should be either rejected or accepted.
- This is fixed in terms of probability level (p) – called level of significance.
- Small p value – small fluctuations in estimates cannot be attributed to sampling variations and the null hypothesis is rejected.
STANDARD ERROR:
- It is the standard deviation of a statistic like the mean, proportion etc
- Calculated by the relation
Standard error of the population = √(p x q)/ n
Where,
p is the proportion of occurrence of an event in the sample
q is (1-p)
n is the sample size
Exam Important
Don’t Forget to Solve all the previous Year Question asked on BIOSTATISTICS-Normal Curve, Test of significance, Standard error
Click Here to Start Quiz
Click Here to Start Quiz

