Question
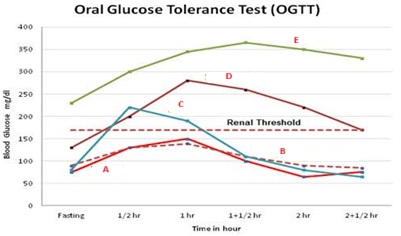
Which of the curves represent diabetes Mellitus?
| A. |
a, b
|
| B. |
b, c
|
| C. |
c, d
|
| D. |
d , e
|
Show Answer
|
Correct Answer � D
Explanation
|
|
The image is a graph from an Oral Glucose Tolerance Test (OGTT) plotting blood glucose (mg/dL) vs time.
In normal individuals (e.g., curve A), the blood glucose level rises post-glucose load and returns to baseline within 2 hours.
In diabetic individuals, the blood glucose:
- Starts at a high fasting level
- Rises sharply after glucose intake
- Remains elevated beyond 2 hours, often above the renal threshold (~180 mg/dL)
Curve D and E:
- Show fasting hyperglycemia
- Blood glucose levels remain persistently high beyond 2 hours
- Both curves cross the renal threshold, indicating glucosuria—typical in Diabetes Mellitus