Question
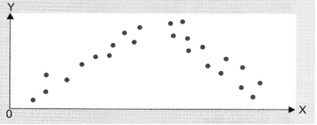
A scatter diagram was plotted as shown below to study the relationship between two quantitative variables. What is the correct interpretation?
| A. |
There is positive correlation between the two variables |
| B. |
There is negative correlation between the two variables |
| C. |
There is no correlation between the two variables |
| D. |
There is a weak negative relation between the two variables |
Show Answer