Question
Which of the following best describes the line E in the graph depicted below?
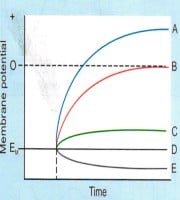
| A. |
A two-fold increase in Extracellular Potassium concentration. |
| B. |
A four-fold decrease in Extracellular Potassium concentration. |
| C. |
A two-fold decrease in Extracellular Potassium concentration. |
| D. |
A four-fold increase in extracellular Potassium concentration. |
Show Answer