Question
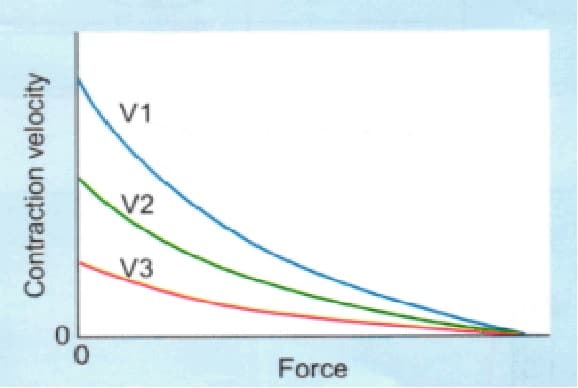
The diagram below shows the force-velocity relationship for isotonic contractions of skeletal muscle. The differences in the three curves result from differences in which of the following?
| A. |
Frequency of muscle contraction
|
| B. |
Muscle mass
|
| C. |
Myosin ATPase activity
|
| D. |
Recruitment of motor units
|
Show Answer
|
Correct Answer � C
Explanation
|
|
Ans. C. Myosin ATPase activity.
- The diagram shows that the maximum velocity of shortening (V-Max) occurs when there is no afterload on the muscle (force = 0).
- Increasing afterload decreases the velocity of shortening until a point is reached where shortening does not occur (isometric contraction) and contraction velocity is thus 0 (where curves intersect X-axis).
- The maximum velocity of shortening is dictated by the ATPase activity of the muscle, increasing to high levels when the ATPase activity is elevated.
- Choice A: Increasing the frequency of muscle contraction will increase the load that a muscle can lift within the limits of the muscle, but will not affect the velocity of contraction.
- Choices B and D: increasing muscle mass, and recruiting additional motor units will increase the maximum load that a muscle can lift, but these will not affect the maximum velocity of contraction.