Question
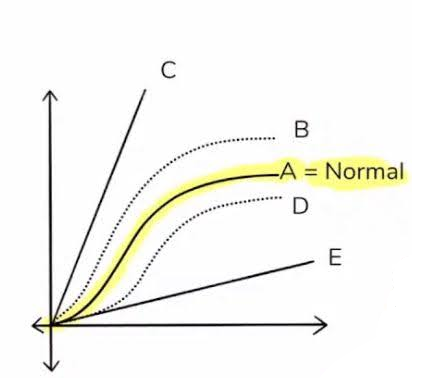
In a packed RBC transfusion, which of the following oxygen dissociation curves is observed?
| A. |
Curve B
|
| B. |
Curve C
|
| C. |
Curve D
|
| D. |
Curve E
|
Show Answer
|
Correct Answer » A
Explanation
|
|
- Curve A represents the normal oxygen–hemoglobin dissociation curve.
- Curve B shows a left shift (increased oxygen affinity).
- Curve D shows a right shift (decreased oxygen affinity).
- Curve C represents myoglobin (very high affinity, hyperbolic curve).
- Curve E represents dissolved oxygen (linear relationship).
Explanation of the Clinical Concept
- Stored packed RBCs have decreased 2,3-Bisphosphoglycerate (2,3-BPG).
- 2,3-BPG normally decreases hemoglobin’s affinity for oxygen, facilitating oxygen release.
- When 2,3-BPG decreases → hemoglobin holds oxygen more tightly.
Explanation of the Correct Answer (Curve B – Left Shift)
- Decreased 2,3-BPG → leftward shift of the dissociation curve
- Left shift means:
- Increased oxygen affinity
- Reduced oxygen delivery to tissues
- Therefore, packed RBC transfusion corresponds to Curve B
Explanation of Other Options
B. Curve C
- Represents myoglobin
- Not related to hemoglobin changes in transfusion
C. Curve D
- Represents right shift
- Seen in acidosis, increased CO₂, increased temperature
- Opposite of stored blood effect
D. Curve E
- Represents dissolved oxygen in plasma
- Not relevant to hemoglobin behavior