
Question
Identify the Distribution Shown.
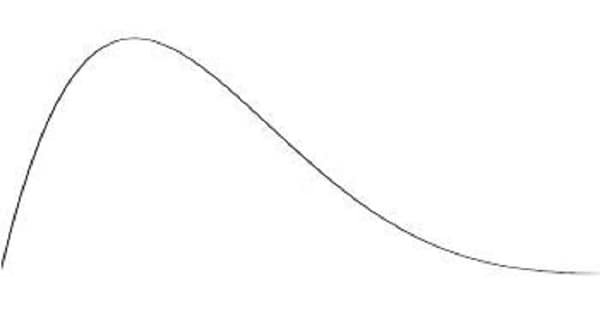
A. Normal Distribution.
B. Right Skewed Distribution.
C. Left Skewed Distribution.
D. Poisonn’s Distribution.
Show Answer
|
Correct Answer » B Explanation |
 |
Ans:B. Right Skewed Distribution
Normal Distribution Curve
- A histogram is the graphical representation of quantitative data .
- It is used for continuous quantitative variables like systolic BP, height, weight etc.
- It has an infinite range.
- Characteristics of a Normal Curve
- It is bell shaped
- It is symmetrical bilaterally.
- Total area of the curve is 1; its mean is zero; and its standard deviation is 1.
- Mean, mode and median coincide and = 0
- It has two inflictions at the points where the curve changes from convexity to concavity
- Mean ± 1 SD includes 68.27% of observations
- Mean ± 2 SD will include 95% of the values and
- Mean ± 3 SD will include 99.5% of observations.
Skew distribution.
Skewed to left (negatively skewed)
- A left-skewed distribution has a long left tail.
- The mean is also to the left of the peak.
- Median>mean.
Skewed to Right (Positively skewed)
- A right-skewed distribution has a long right tail.
- The mean is also to the right of the peak.
- Median<mean.
Poisson distribution .
- Limiting form of binominal distribution when probability of success is closer to zero and numbers of trials are infinite. Mean=variance.
