Question
A scatter diagram was plotted as shown below to study the relationship between two quantitative variables. What is the correct interpretation?
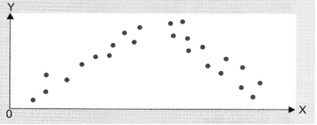
A. There is correlation between the two variables and the Pearson’s coefficient is 1
B. There is correlation between the two variables and the Pearson’s coefficient is 1
C. There is no correlation between the two variables
D. There is no relation between the two variables
Show Answer